Choosing the right Filter Units in 2026 starts with the job they must perform, not the product label. What enters the air or liquid? How much must pass through each hour? These details matter. A compact unit may fit neatly beneath a workbench yet struggle when flow demand rises. A finer filter may capture smaller particles, but it can also increase pressure drop and energy use.
Dr. Peter Tsai’s research on filter media offers useful context. The following is a paraphrase, not a verbatim quotation: “Match the filter media to the particles and operating conditions—not just the housing.” This guide will help readers compare filtration needs, media types, airflow or flow rate, efficiency claims, pressure drop, and maintenance access. It will also explain how to assess manufacturer data and ask for evidence that fits the actual application. Look beyond a glossy specification sheet. A filter that performs well in a laboratory may behave differently in a dusty room or a humid process line. Small details count: available clearance, seal fit, replacement intervals, and the space needed to change a loaded filter. Some choices remain imperfect. Budget, size, and performance rarely align exactly. The aim is a documented, practical decision that can be reviewed as operating conditions change.
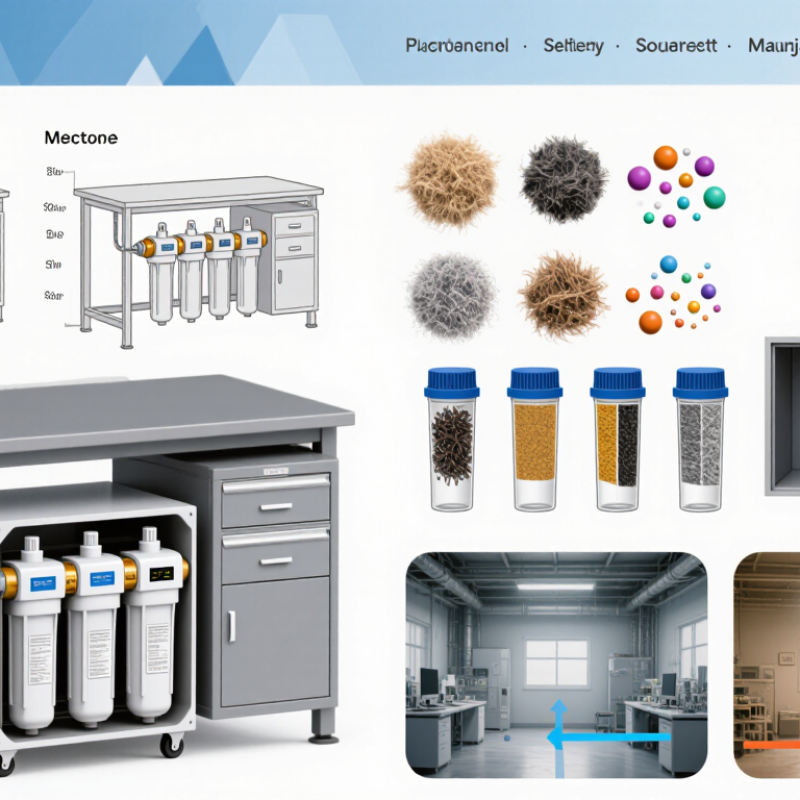
A filter unit should be chosen for the material it needs to remove, not just its size. Pleated particulate filters capture dust and suspended solids, making them useful in ventilation systems and many water prefilters. Their efficiency depends on particle size and airflow or liquid flow. For odors and some dissolved organic compounds, activated carbon is often more suitable. It does not remove every contaminant. Small detail matters.
Membrane units separate particles by pore size and are commonly used where finer filtration is required. They can be sensitive to clogging, so check the incoming fluid and plan for prefiltration when needed. HEPA-type units are designed for high-efficiency airborne particle capture in controlled indoor settings; they are not a substitute for gas or vapor filtration. A filter that works well in a clean test may perform differently in a dusty room or a system with variable flow.
Before choosing, compare the required removal level with the unit’s rated capacity, pressure drop, and material compatibility. Check operating temperature and humidity too. In practice, maintenance access is easy to overlook: a filter that is difficult to replace may stay in service too long. I would not assume a higher efficiency rating is always better, since added resistance can reduce system flow. Note the expected service interval, then verify it against actual operating conditions. A simple pressure reading across the unit can reveal loading before performance noticeably changes.
Start with the contaminant, not the catalog. Record particle size, concentration, airflow, temperature, humidity, and allowable pressure drop. A dusty workshop and a humid food-processing room need different media and housings. Check operating data during peak production, too; average conditions can hide short, demanding cycles. WHO’s 2021 air quality guidelines set a 24-hour PM2.5 guideline of 15 μg/m³. This is an ambient-air benchmark, not a universal indoor target, but it shows why particle size matters.
Match test methods to the application. ISO 16890 classifies general ventilation filters by their removal of different particle-size ranges, while ASHRAE Standard 52.2 uses MERV ratings. These ratings are not interchangeable. Also compare clean and loaded pressure drop: a highly efficient filter may increase fan energy or reduce airflow if the unit is undersized. Verify the housing seal, service access, and replacement interval under real operating conditions. Small leaks matter.
Choosing filter media starts with the particles you need to capture. Fiberglass media generally offers low resistance but limited fine-particle capture. Pleated synthetic or glass-fiber media can capture smaller particles, yet may increase pressure drop. Fit matters. Check the unit’s dimensions, airflow direction, and rated operating conditions before comparing efficiency labels.
ASHRAE Standard 52.2-2017 assigns MERV ratings using particle-size groups. A MERV 13 filter must achieve at least
These are test results, not a promise of identical performance in every system. ISO 16890 classifies filters by ePM1, ePM2.5, and ePM10 efficiency, offering another way to compare media.
The scales are not directly interchangeable.
Compatibility can decide whether a high-efficiency filter works well in practice. Check the equipment manual and pressure-drop data at the intended airflow; a restrictive filter may reduce airflow in a system not designed for it. A clean filter and a snug frame also matter. Gaps let air bypass the media. There is no perfect single number. A rating alone can hide the trade-off between particle capture and airflow, so compare test conditions as carefully as the label.
How to Choose the Right Filter Units in 2026?
Sizing Filter Units for Flow Rate and Capacity
Start with the air the space needs, not the largest number on a product label. Calculate room volume, then multiply by the target air changes per hour and divide by 60. For a 30-by-20-foot room with a 10-foot ceiling, five air changes require about 500 cubic feet per minute. CDC guidance recommends aiming for five or more clean-air changes per hour where feasible, but occupancy and room use matter. Measure twice. A filter’s rated airflow may fall as dust loads the media or resistance rises, so check performance at the expected operating pressure.
Use recognized test data to compare units. The U.S. EPA’s 2018 Guide to Air Cleaners in the Home recommends a smoke CADR of at least two-thirds of a room’s area in square feet. That is a useful residential benchmark, not a universal sizing rule for industrial systems. For particle filters, ANSI/ASHRAE Standard 52.2 rates removal efficiency across particle sizes; review the rating alongside pressure drop at your required flow. A high efficiency rating can mean more resistance. I would not trust a catalog maximum alone. Check fan curves, duct losses, and replacement-filter limits, then leave a practical margin for loading. Real rooms are rarely perfect boxes.
Preliminary sizing examples for liquid filtration. The filtration rates and operating conditions below are planning assumptions, not universal design limits; confirm them through application testing and filter-unit specifications.
| Example application | Design flow rate | Assumed design filtration rate | Calculated minimum filter area | Area allowance | Preliminary selected area | Assumed suspended-solids load and service interval | Estimated solids capacity required per interval |
|---|---|---|---|---|---|---|---|
| General water treatment | 10 m³/h | 10 m³/(m²·h) | 1.00 m² | 25% | 1.25 m² | 10 mg/L; 8 hours | 0.80 kg |
| Cooling-water side-stream filtration | 25 m³/h | 15 m³/(m²·h) | 1.67 m² | 30% | 2.17 m² | 20 mg/L; 8 hours | 4.00 kg |
| Process liquid with moderate solids | 5 m³/h | 5 m³/(m²·h) | 1.00 m² | 30% | 1.30 m² | 50 mg/L; 8 hours | 2.00 kg |
| High-solids liquid prefiltration | 3 m³/h | 1.5 m³/(m²·h) | 2.00 m² | 50% | 3.00 m² | 500 mg/L; 4 hours | 6.00 kg |
| Fine polishing filtration | 2 m³/h | 2 m³/(m²·h) | 1.00 m² | 25% | 1.25 m² | 5 mg/L; 12 hours | 0.12 kg |
Calculation basis: Minimum filter area = design flow rate ÷ assumed design filtration rate. Preliminary selected area = minimum area × (1 + area allowance). Solids capacity required = flow rate × suspended-solids concentration × service interval, assuming all incoming suspended solids are retained.
Important: Actual filtration rate, capture efficiency, pressure drop, and usable solids-holding capacity depend on the liquid, particle-size distribution, filter media, operating pressure, and cleaning method. Validate these values for the specific duty before selecting equipment.
Evaluating Maintenance, Safety, and Lifecycle Costs
A low purchase price can hide expensive maintenance. Compare filter-media life, replacement time, access requirements, and disposal needs. ASHRAE Standard 52.2 rates particle-removal performance using MERV, but MERV alone does not show a unit’s energy use. Check the manufacturer’s pressure-drop data against your system’s airflow needs. Small details matter.
Maintenance affects both cost and reliability. The U.S. Department of Energy’s Operations & Maintenance Best Practices guide reports that predictive maintenance can save 8–12% compared with preventive maintenance, and 30–40% compared with reactive maintenance. Those figures cover maintenance programs generally, not filter units alone. Still, pressure readings and scheduled inspections can help teams replace loaded filters before airflow becomes a problem. A clipboard log works, though it is easy to forget.
Safety belongs in the evaluation, too. Look for secure service doors, clear working space, and a design that limits dust release during changeouts. Check seals for gaps; bypass air can carry particles around the media. Estimate lifecycle cost by adding purchase price, fan-energy impact, labor, replacement frequency, and downtime. DOE’s figures are not a promise of savings. Local operating conditions can change the result, and a neat spreadsheet may miss the awkward access panel that slows every service visit.